Why is the ActiveCount PMI statistic on a WebContainer thread pool non zero even if no HTTP requests are processed?
The ActiveCount statistic on a thread pool in WebSphere is defined as the "the number of concurrently active threads" managed by that thread pool. This metric is particularly useful on the WebContainer thread pool because it gives an indication of the number of HTTP requests processed concurrently. If that metric approaches its maximum (which is determined by the maximum pool size), then you know that either the pool is simply too small or that there is a bottleneck that blocks the processing of some of the requests.
One would expect that the ActiveCount drops to zero when no HTTP requests are received. If you have ever used that statistic, then you may have noticed that this is not the case, and you may have wondered why this is so. There are actually two reasons for that:
-
WebSphere always initializes the metric with a zero value and then increments and decrements the value as tasks begin and finish executing on the thread pool. That works fine if the statistic is enabled in the WebSphere configuration because the metric will be initialized when the thread pool is started. On the other hand, if the statistic is switched on at runtime, then some threads may already be active and the values reported by PMI will be incorrect. More precisely, there will be a non zero offset between the reported metric and the actual number of concurrently active threads. In that case, the value of the metric may drop to a negative value if no HTTP requests are received.
-
In WebSphere, thread pools are instances of a generic component and that component is used for different types of thread pools. A thread pool provides a facility to execute tasks on a set of threads that it manages, but it is completely agnostic to the nature of the tasks being executed. In the case of the WebContainer thread pool, these tasks are scheduled by the HTTP request processor. Most of these tasks actually represent HTTP requests being processed by a servlet. However, there is also a small number of constantly running tasks waiting for new HTTP requests to come in. In a thread dump, they are identified by the following stack trace:
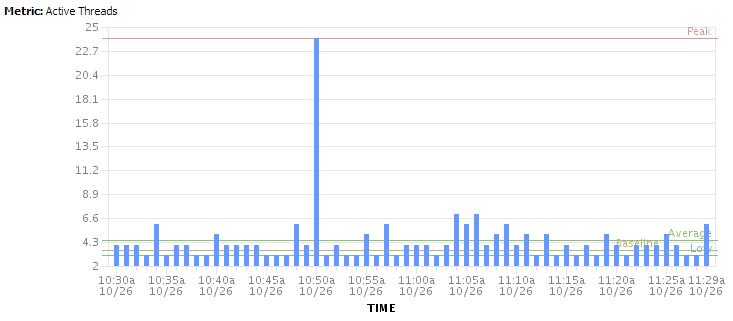
"WebContainer : 3" - Thread t@86
  java.lang.Thread.State: RUNNABLE
    at com.ibm.io.async.AsyncLibrary.aio_getioev3(Native Method)
    at com.ibm.io.async.AsyncLibrary.getCompletionData3(AsyncLibrary.java:625)
    at com.ibm.io.async.ResultHandler.runEventProcessingLoop(ResultHandler.java:530)
    at com.ibm.io.async.ResultHandler$2.run(ResultHandler.java:905)
    at com.ibm.ws.util.ThreadPool$Worker.run(ThreadPool.java:1783)
Since a thread pool is a generic component which doesn't know anything about the HTTP request processor, it simply counts these tasks as active threads, even if they are actually idle waiting for new HTTP requests. That is why the ActiveCount never becomes zero even on a completely idle system. It should be noted that the HTTP request processor may execute more than one of these tasks and that their number is not necessarily constant over time. This is illustrated by the following plot of the ActiveCount metric, where one can see that (on that particular system) the ActiveCount never drops below 3: