Heap starvation on WebSphere Process Server 6.1 caused by internal cache
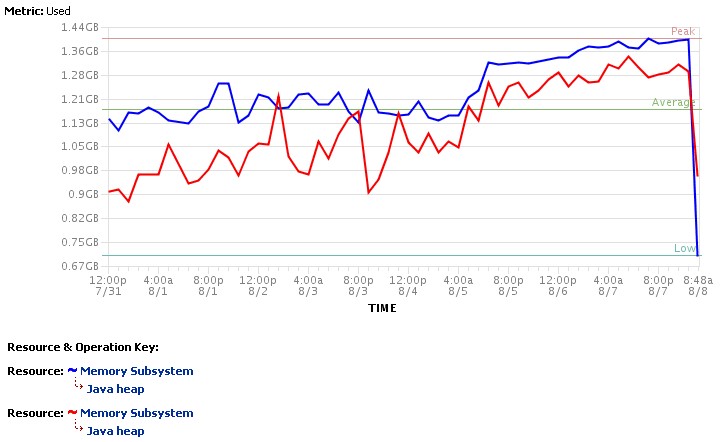
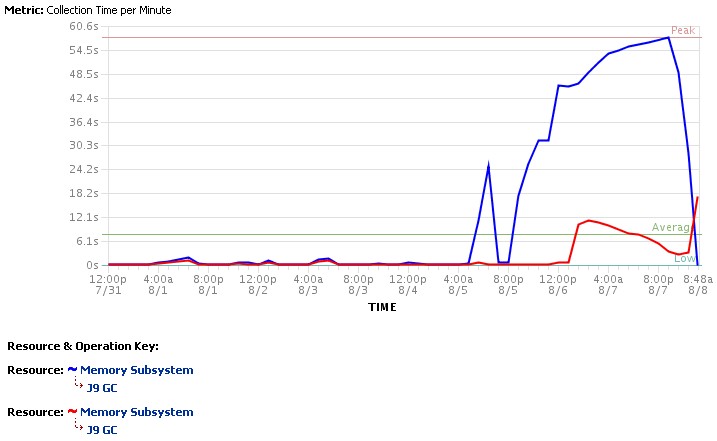
Some time ago we had an incident where both members of a WebSphere Process Server 6.1 cluster encountered a heap starvation and needed to be restarted:


That incident occurred after one of the external service providers we connect to reported a problem causing an increase in response time.
Analysis of a heap dump taken before the restart of the WPS servers showed that a large amount of heap (480MB of 1.4GB) is consumed by objects of type com.ibm.ws.sca.internal.webservice.handler.PortHandler$OperationHandlerList. That appears to be an internal data structure used by SCA Web service imports (We are running lots of SCA modules on that cluster). A closer look at OperationHandlerList reveals that this class acts as a cache for objects of type com.ibm.ws.webservices.engine.client.Call, which is WebSphere's implementation of the javax.xml.rpc.Call API.
In fact, Call objects are used during the invocation of an operation on an SCA import with Web service binding, but they are both stateful and costly to create. To avoid this cost, WPS uses a caching mechanism that takes into account the stateful nature of these objects. Basically, OperationHandlerList appears to be designed as a pool of Call objects that is initially empty and that has a hardcoded maximum size of 100 entries. When an SCA import is invoked, WPS will attempt to retrieve an existing Call object from the pool or create a new one if none is available. After the completion of the invocation, WPS then puts the instance (back) to the pool for later reuse.
What is important to understand is that there is a separate pool (i.e. a separate OperationHandlerList instance) for each operation defined by each SCA Web service import. In addition, entries in these pools are never expunged. From the explanations given in the previous paragraph it is easy to see that the number of Call objects stored in a given OperationHandlerList instance is therefore equal to the maximum concurrency reached (since the start of the server) for invocations of the corresponding operation. That explains why the heap consumed by these pools may increase sharply after a performance problem with one of the Web services consumed by WPS: in general, a degraded response time of a service provider will cause an increase in concurrency because clients continue to send requests to WPS. That also explains why the memory is never released and the issue has the same symptoms as a memory leak.
As indicated above, there is a separate pool for each operation. This means that there may be a large number of these pools in a given WPS instance. However, this is usually not what causes the problem. The issue may already occur if there is only a limited number of operations for which the maximum concurrency increases. The reason is that an individual Call object may consume a significant amount of memory. E.g. in our case, we found one OperationHandlerList instance (that had reached its maximum capacity of 100 entries) that accounted for 177MB of used heap alone.
Note: At first glance, the issue described in this post seems to match APAR JR35210. However, that APAR simply describes the problem as a memory leak without giving precise information about the conditions that trigger the issue, except that it relates the issue to the usage of dynamic endpoints. However, our findings indicate that the issue is not (necessarily) related to dynamic endpoints. JR35210 may therefore be a different (but related) issue.
